The Margaret Chase Smith Policy Center is a nonpartisan, independent research and public service unit of the University of Maine. The MCS Policy Center contributes to the quality of public dialogue concerning local, state, regional, and national policy issues through applied policy research and engaging with the community. Our research is interdisciplinary, bringing together faculty, staff, and students from a variety of backgrounds-Anthropology, Ecology, Economics, Engineering, History, Politics, Psychology, Public Health, Social Work, and Sociology-with external policy experts to address issues confronting the state and nation.
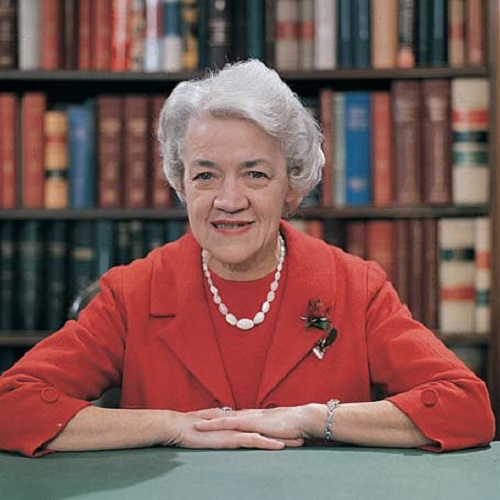
Created in 1989, the Center was named to honor the legacy of Senator Margaret Chase Smith who served as a model of civil discourse and integrity.
The Policy Center informs public policy processes and societal decision-making through timely research and applied public policy activities focused on critical issues facing Maine and the nation.
In the spirit of the Honorable Margaret Chase Smith, we strive to advance a tradition of independent, objective research designed to support effective, transparent, and equitable policy processes. The Policy Center values open communication grounded in civility and a willingness to engage respectfully across differences. Building a sense of community through collaboration is core to our aspiration to improve policy. We value inclusive communication that aims to advance relationships among policymakers, community leaders, and students, faculty, and staff of the University of Maine.

Today, we are well aware of the partisanship in our news and among our political leaders. Perhaps I am old fashioned in that I believe that people still can, and will, listen to each other and to their stories. But a policy center is about more than stories; it is about helping to make good policy informed by data and shared values.
The MCS Policy Center is a nonpartisan, independent research and public service unit of the University of Maine. Created in 1989, the Center was named to continue the legacy of Senator Margaret Chase Smith, a model of bipartisanship, civil discourse, and integrity. As Margaret Chase Smith said: “My creed is that public service must be more than doing a job efficiently and honestly. It must be a complete dedication to the people and to the nation with full recognition that every human being is entitled to courtesy and consideration, that constructive criticism is not only to be expected but sought, that smears are not only to be expected but fought, that honor is to be earned, not bought.”
We offer a number of student programs and scholarships that help prepare the next generation of Maine leaders. Center faculty and staff conduct research on important issues facing Maine and the nation. And we host outreach and collaborative programs that foster engagement between Maine and national thought leaders and the University of Maine community.
I invite you to explore our website to see the work of the Center’s amazing team of faculty, researchers, students, and staff. We welcome your input and support and hope you will join us in helping with our mission to realize MCS’s creed.
Jonathan Rubin, Director